Orbit Computation
This tutorial demonstrates how to generate satellite orbits using various models.
Setup
import numpy as np
import pandas as pd

import plotly.graph_objs as go

from ostk.physics.unit import Length
from ostk.physics.unit import Angle
from ostk.physics.time import Scale
from ostk.physics.time import Instant
from ostk.physics.time import Duration
from ostk.physics.time import Interval
from ostk.physics.time import DateTime
from ostk.physics import Environment

from ostk.astrodynamics.trajectory import Orbit
from ostk.astrodynamics.trajectory.orbit.model import Kepler
from ostk.astrodynamics.trajectory.orbit.model.kepler import COE
from ostk.astrodynamics.trajectory.orbit.model import SGP4
from ostk.astrodynamics.trajectory.orbit.model.sgp4 import TLE

from ostk.astrodynamics.utilities import convert_state
from ostk.astrodynamics.display import create_2d_map
from ostk.astrodynamics.display import create_3d_globe
SGP4
Computation
environment = Environment.default()
Create a Classical Orbital Element (COE) set:
a = Length.kilometers(7000.0)
e = 0.0001
i = Angle.degrees(35.0)
raan = Angle.degrees(40.0)
aop = Angle.degrees(45.0)
nu = Angle.degrees(50.0)

coe = COE(a, e, i, raan, aop, nu)
Setup a Keplerian orbital model:
epoch = Instant.date_time(DateTime(2018, 1, 1, 0, 0, 0), Scale.UTC)
earth = environment.access_celestial_object_with_name("Earth")

keplerian_model = Kepler(coe, epoch, earth, Kepler.PerturbationType.No)
Create a Two-Line Element (TLE) set:
tle = TLE(
    "1 39419U 13066D   18260.77424112  .00000022  00000-0  72885-5 0  9996",
    "2 39419  97.6300 326.6556 0013847 175.2842 184.8495 14.93888428262811",
)
Setup a SGP4 orbital model:
sgp4_model = SGP4(tle)
Setup the orbit:
# orbit = Orbit(keplerian_model, environment.access_celestial_object_with_name("Earth"))
orbit = Orbit(sgp4_model, environment.access_celestial_object_with_name("Earth"))
Now that the orbit is set, we can compute the satellite position:
start_instant = Instant.date_time(DateTime(2018, 9, 5, 0, 0, 0), Scale.UTC)
end_instant = Instant.date_time(DateTime(2018, 9, 6, 0, 0, 0), Scale.UTC)
interval = Interval.closed(start_instant, end_instant)
step = Duration.minutes(1.0)
Generate a time grid:
instants = interval.generate_grid(step)
states = [[instant, orbit.get_state_at(instant)] for instant in instants]
orbit_data = [convert_state(state) for state in states]
---------------------------------------------------------------------------
AttributeError                            Traceback (most recent call last)
Cell In[13], line 1
----> 1 orbit_data = [convert_state(state) for state in states]

Cell In[13], line 1, in <listcomp>(.0)
----> 1 orbit_data = [convert_state(state) for state in states]

File /usr/local/lib/python3.11/dist-packages/ostk/astrodynamics/utilities.py:384, in convert_state(state)
    360 def convert_state(
    361     state: State,
    362 ) -> tuple[str, float, float, float, float, float, float, float, float, float]:
    363     """
    364     Convert a State into dataframe-ready values.
    365     - Instant (str)
   (...)
    381         tuple[str, float, float, float, float, float, float, float, float, float]: The dataframe-ready values.
    382     """
--> 384     lla: LLA = lla_from_state(state)
    386     instant: Instant = state.get_instant()
    388     return (
    389         str(instant.to_string()),
    390         float(instant.get_modified_julian_date(Scale.UTC)),
   (...)
    395         float(lla.get_altitude().in_meters()),
    396     )

File /usr/local/lib/python3.11/dist-packages/ostk/astrodynamics/utilities.py:184, in lla_from_state(state)
    173 def lla_from_state(state: State) -> LLA:
    174     """
    175     Return latitude (degrees), longitude (degrees), altitude (meters) float list from a state.
    176
   (...)
    181         LLA: The LLA.
    182     """
--> 184     return lla_from_position(state.get_position(), state.get_instant())

AttributeError: 'list' object has no attribute 'get_position'
orbit_df = pd.DataFrame(
    orbit_data,
    columns=[
        "$Time^{UTC}$",
        "$MJD^{UTC}$",
        "$x_{x}^{ECI}$",
        "$x_{y}^{ECI}$",
        "$x_{z}^{ECI}$",
        "$v_{x}^{ECI}$",
        "$v_{y}^{ECI}$",
        "$v_{z}^{ECI}$",
        "$Latitude$",
        "$Longitude$",
        "$Altitude$",
    ],
)
Output
Table:
orbit_df.head()
| $Time^{UTC}$ | $MJD^{UTC}$ | $x_{x}^{ECI}$ | $x_{y}^{ECI}$ | $x_{z}^{ECI}$ | $v_{x}^{ECI}$ | $v_{y}^{ECI}$ | $v_{z}^{ECI}$ | $Latitude$ | $Longitude$ | $Altitude$ | |
|---|---|---|---|---|---|---|---|---|---|---|---|
| 0 | 2018-09-05 00:00:00 [UTC] | 58366.000000 | -1.713399e+06 | 4.882015e+05 | 6.729062e+06 | -4963.295593 | 5457.439154 | -1666.177507 | 75.158968 | -179.618850 | 602749.955899 |
| 1 | 2018-09-05 00:01:00 [UTC] | 58366.000694 | -2.007361e+06 | 8.143839e+05 | 6.614883e+06 | -4831.972213 | 5411.464113 | -2138.444901 | 71.875980 | 173.964827 | 601723.868966 |
| 2 | 2018-09-05 00:02:00 [UTC] | 58366.001389 | -2.292825e+06 | 1.137119e+06 | 6.472626e+06 | -4680.139327 | 5342.558791 | -2601.814472 | 68.453880 | 169.415947 | 600586.133346 |
| 3 | 2018-09-05 00:03:00 [UTC] | 58366.002083 | -2.568580e+06 | 1.455038e+06 | 6.302882e+06 | -4508.419228 | 5250.994715 | -3054.324538 | 64.948448 | 166.007089 | 599350.279488 |
| 4 | 2018-09-05 00:04:00 [UTC] | 58366.002778 | -2.833452e+06 | 1.766793e+06 | 6.106362e+06 | -4317.518408 | 5137.138312 | -3494.054108 | 61.389166 | 163.333225 | 598031.727629 |
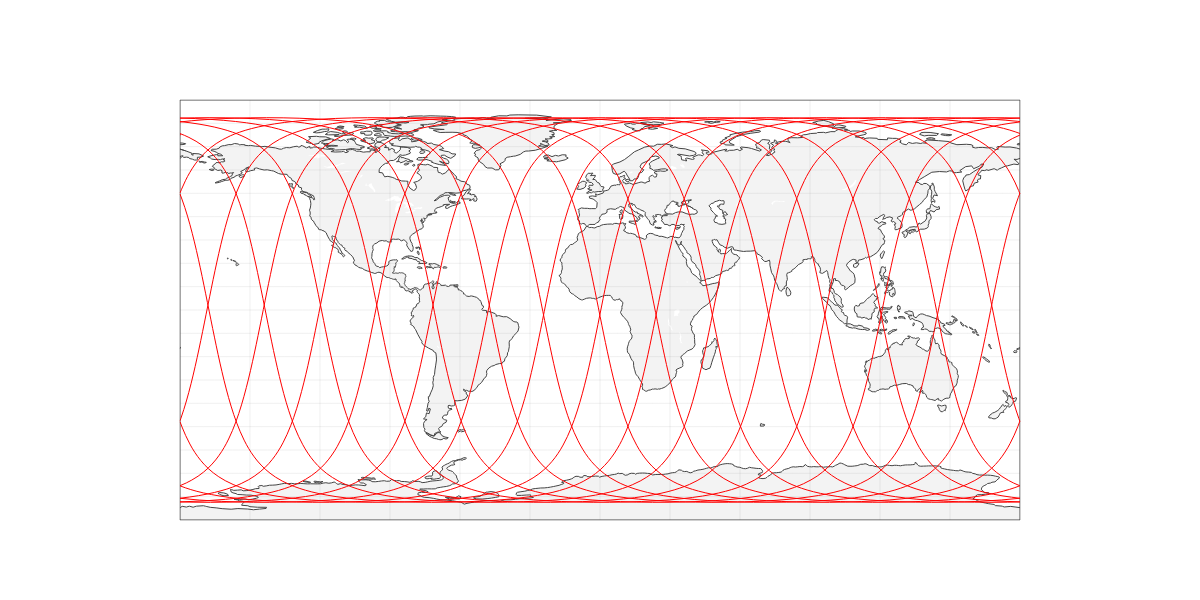
2D plot, over World Map:
figure = create_2d_map(
    data=go.Scattergeo(
        lon=orbit_df["$Longitude$"],
        lat=orbit_df["$Latitude$"],
        mode="lines",
        line=go.scattergeo.Line(width=1, color="red"),
    ),
)
figure.layout.update(
    {
        "width": 1200,
        "height": 600,
    }
)

figure.show("png")
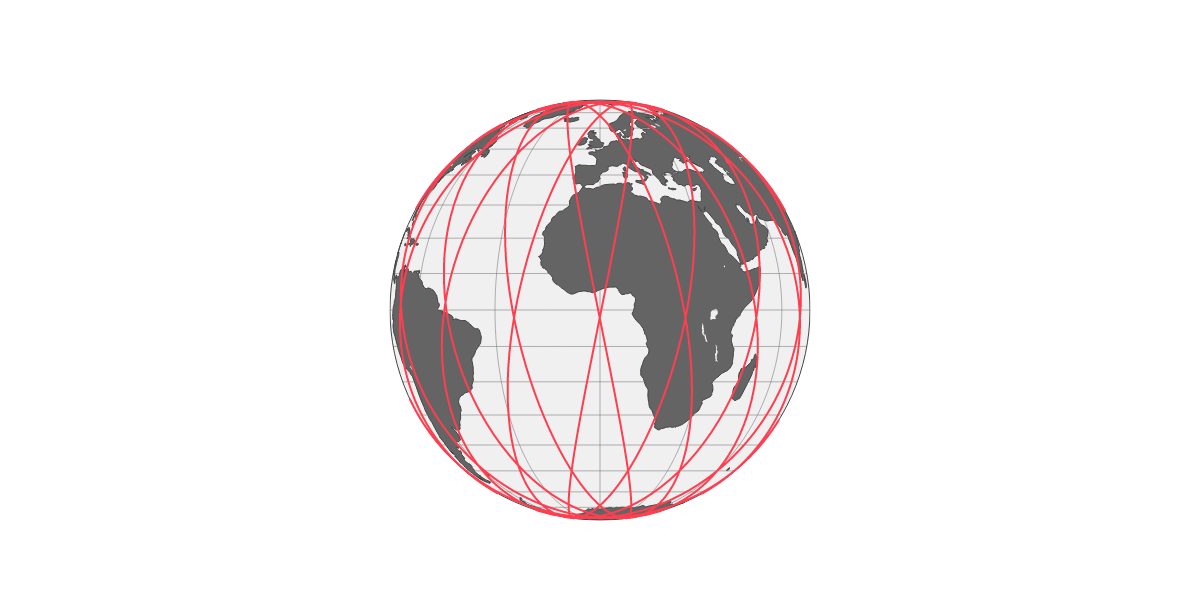
3D plot, in Earth Fixed frame:
figure = create_3d_globe(
    data=[
        go.Scattergeo(
            lon=orbit_df["$Longitude$"],
            lat=orbit_df["$Latitude$"],
            mode="lines",
            line=go.scattergeo.Line(width=2, color="rgb(255, 62, 79)"),
        )
    ],
)
figure.layout.update(
    {
        "width": 1200,
        "height": 600,
    }
)

figure.show("png")
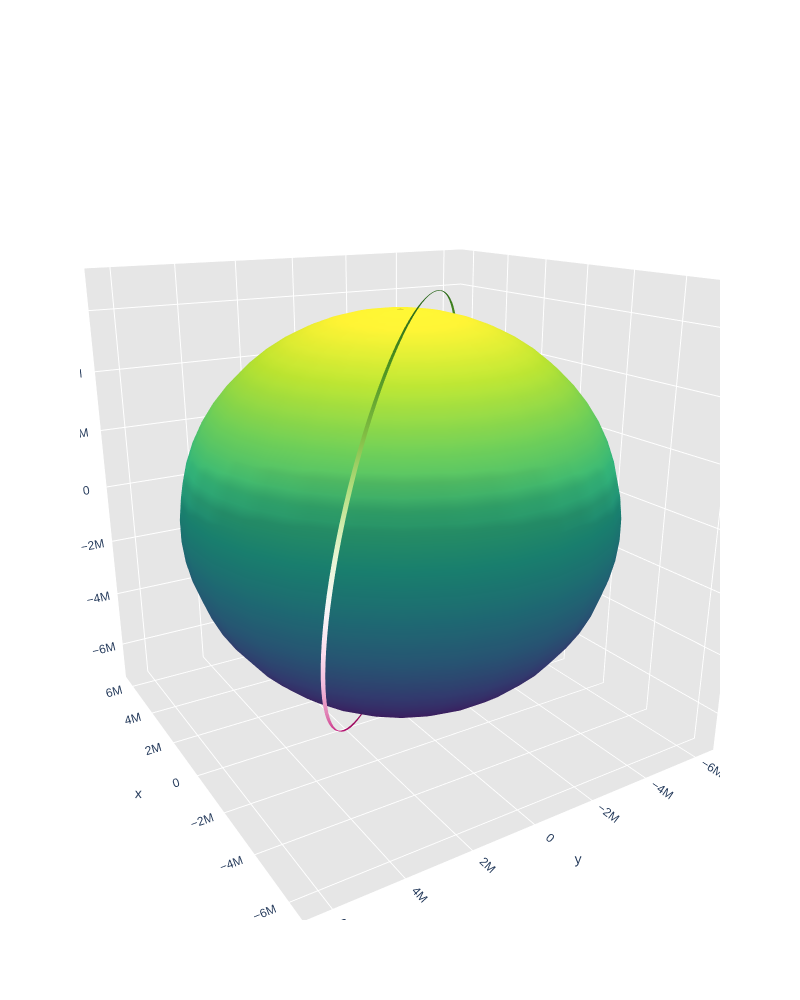
3D plot, in Earth Inertial frame:
theta = np.linspace(0, 2 * np.pi, 30)
phi = np.linspace(0, np.pi, 30)

theta_grid, phi_grid = np.meshgrid(theta, phi)

r = float(earth.get_equatorial_radius().in_meters())

x = r * np.cos(theta_grid) * np.sin(phi_grid)
y = r * np.sin(theta_grid) * np.sin(phi_grid)
z = r * np.cos(phi_grid)

earth_surface = go.Surface(x=x, y=y, z=z, colorscale="Viridis", showscale=False)

trace = go.Scatter3d(
    x=orbit_df["$x_{x}^{ECI}$"],
    y=orbit_df["$x_{y}^{ECI}$"],
    z=orbit_df["$x_{z}^{ECI}$"],
    mode="lines",
    marker=dict(
        size=0, color=orbit_df["$x_{z}^{ECI}$"], colorscale="Viridis", showscale=False
    ),
    line=dict(color=orbit_df["$x_{z}^{ECI}$"], width=1),
)

figure = go.Figure(
    data=[earth_surface, trace],
    layout=go.Layout(
        title=None,
        width=800,
        height=1000,
        showlegend=False,
        scene=go.layout.Scene(
            xaxis=dict(
                gridcolor="rgb(255, 255, 255)",
                zerolinecolor="rgb(255, 255, 255)",
                showbackground=True,
                backgroundcolor="rgb(230, 230,230)",
            ),
            yaxis=dict(
                gridcolor="rgb(255, 255, 255)",
                zerolinecolor="rgb(255, 255, 255)",
                showbackground=True,
                backgroundcolor="rgb(230, 230,230)",
            ),
            zaxis=dict(
                gridcolor="rgb(255, 255, 255)",
                zerolinecolor="rgb(255, 255, 255)",
                showbackground=True,
                backgroundcolor="rgb(230, 230,230)",
            ),
            camera=dict(
                up=dict(x=0, y=0, z=1),
                eye=dict(
                    x=-1.7428,
                    y=1.0707,
                    z=0.7100,
                ),
            ),
            aspectratio=dict(x=1, y=1, z=1),
            aspectmode="manual",
        ),
    ),
)

figure.show("png")